Features
Smart & Simple Remote App Log Viewer.
Detect issues in real-time, before users do.
Smarter Simpler Search
LOGBOOK
When a user complains about experiencing an issue, it is often impossible to know exactly what happened behind the scenes. Even if you have a logging system to retrieve user's logs, searching through endless logs is often cumbersome and annoying.
With Shipbook's Logbook, you have the power to retrieve users' logs and crashes in one smart and simple search. With extensive parameters such as: User ID, device type, app version, time, log message text and more, you can find exactly what you are looking for.
Shipbook gives you the whole picture, with remote logs of the entire event trail, in context, so you can analyze exactly what happened instead of trying to replicate the issue in the lab.
Fixing issues in your code has never been faster and easier.
Read moreFollow a Request from the App to Your Server
FULL FLOW
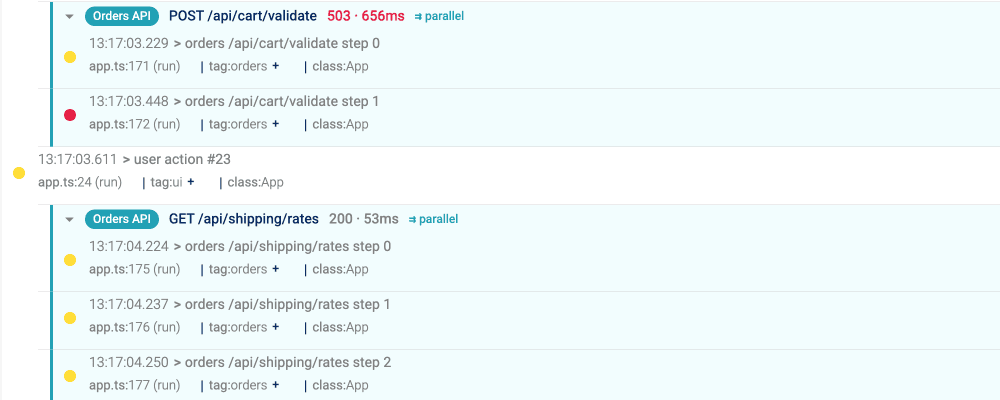
A user taps a button, the app calls your backend, and something goes wrong. Until now that meant two Logbooks and a lot of timestamp matching: the app's session on one side, the server's logs on the other.
Link them and Shipbook shows one timeline. Open an iOS, Android, Flutter, React Native or browser session that called your Node.js or Python backend and click View full flow: the app's logs and the server's logs appear together, in time order. Every backend request is its own block with its route, status, duration and the logs it wrote, and requests that ran in parallel never mix.
Shipbook gives Node.js and Python servers the same request blocks on their own, linked or not, and measures them in requests: see the next section.
One line in your app connects the two sides: attach the Shipbook session header to the requests it sends to your backend.
Your Server, Request by Request
NODE.JS
Shipbook makes a server's logs readable. A server writes thousands of log lines a minute, from requests that run at the same time, and read as one stream they tell you nothing. The Node.js SDK keeps every request's logs together: in the Logbook each request is a block headed by its method, route, status and duration, holding only its own logs, however many ran in parallel.
Background jobs and MCP calls get the same block, so a failing job reads like a failing endpoint. If the process crashes or is stopped, the SDK sends what it has before it exits, so the last lines are never lost.
Shipbook measures a server in requests, not sessions: the dashboards, release health, Loglytics error rates and alerts all count requests, down to the minute. An error rate is the share of requests that hit the issue.
Express and NestJS are a one-line setup. Everything else is automatic.
The Python SDK Beta gives FastAPI, Flask and Django servers the same request blocks.
AI-Powered Insights: Logchat Unleashed!
LOGCHAT
Logchat is an AI-powered chat tool that analyzes mobile application logs, providing two key advantages:
It enables non-technical users, such as Product Managers (PM), Quality Assurance (QA) teams, and Customer Support (CS) representatives, to effortlessly review logs through natural conversations and swiftly pinpoint the root cause of issues.
It empowers technical users, specifically developers, to harness the chat for comprehensive log analysis, assisting them in discovering valuable insights and uncovering hidden patterns that they might have otherwise overlooked.
Logchat facilitates seamless collaboration between both technical and non-technical team members, streamlining the troubleshooting process and bolstering productivity in resolving application-related issues.
Read more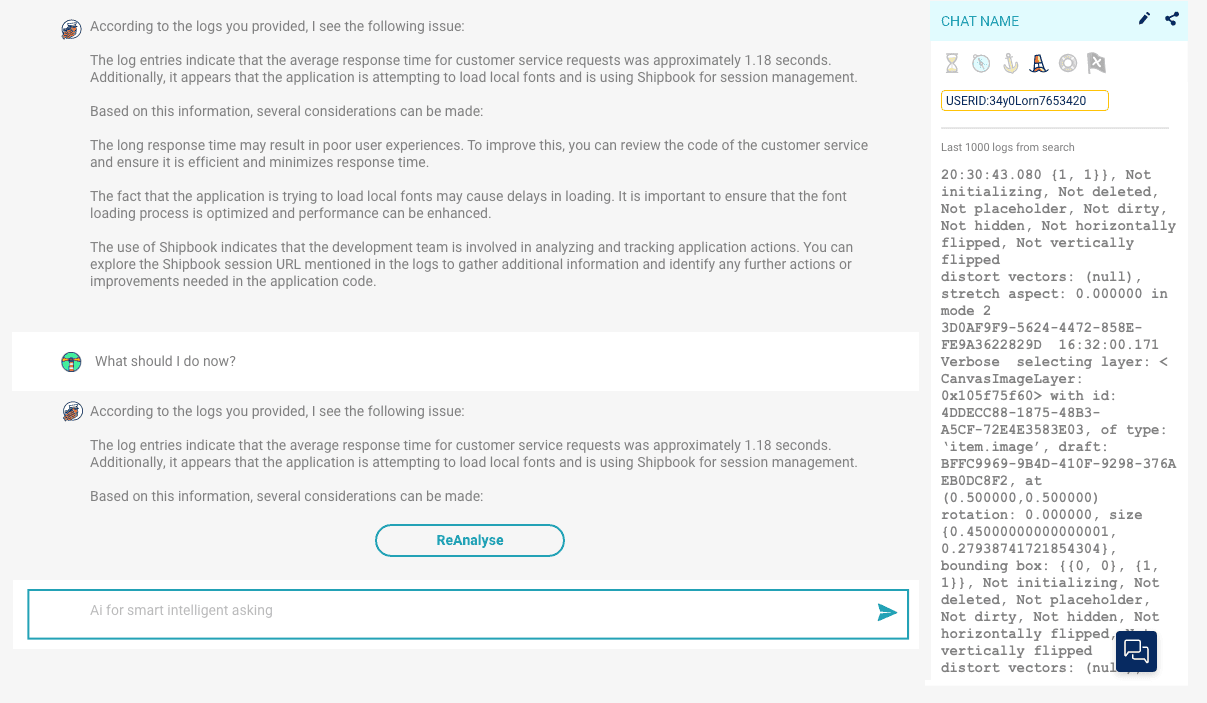
Let AI Agents Debug Your App
MCP INTEGRATION
Shipbook supports the Model Context Protocol (MCP) — giving AI coding assistants direct, secure access to your application logs and error data.
Connect Claude, Cursor, GitHub Copilot, OpenAI Codex, or Google Antigravity to Shipbook and let your AI agent search logs, analyze Loglytics errors, and suggest code fixes — all from your editor.
With OAuth 2.1 security, your credentials are never shared with the AI assistant. Set up in minutes, debug in seconds.
Learn more & set upWorks with your favorite AI tools




Example query:
“Find error logs for user X and fix any code issues”
Stop Looking. Start Fixing.
LOGLYTICS
A unique proactive patented system.
Relying only on QA for issue detection will have limitations. There will always be undiscovered bugs that will appear in production and effect end user experience.
Shipbook's unique algorithm organizes recurring error logs into one comprehensive list. Logs are listed according to frequency. The more urgent the log, the higher up it will be.
Be proactive and fix your apps issues before users notice them.
Read moreFrom an Issue to a Pull Request
AI FIX
Knowing that an issue exists is only the start. You still have to find where it comes from in your code, and fix it.
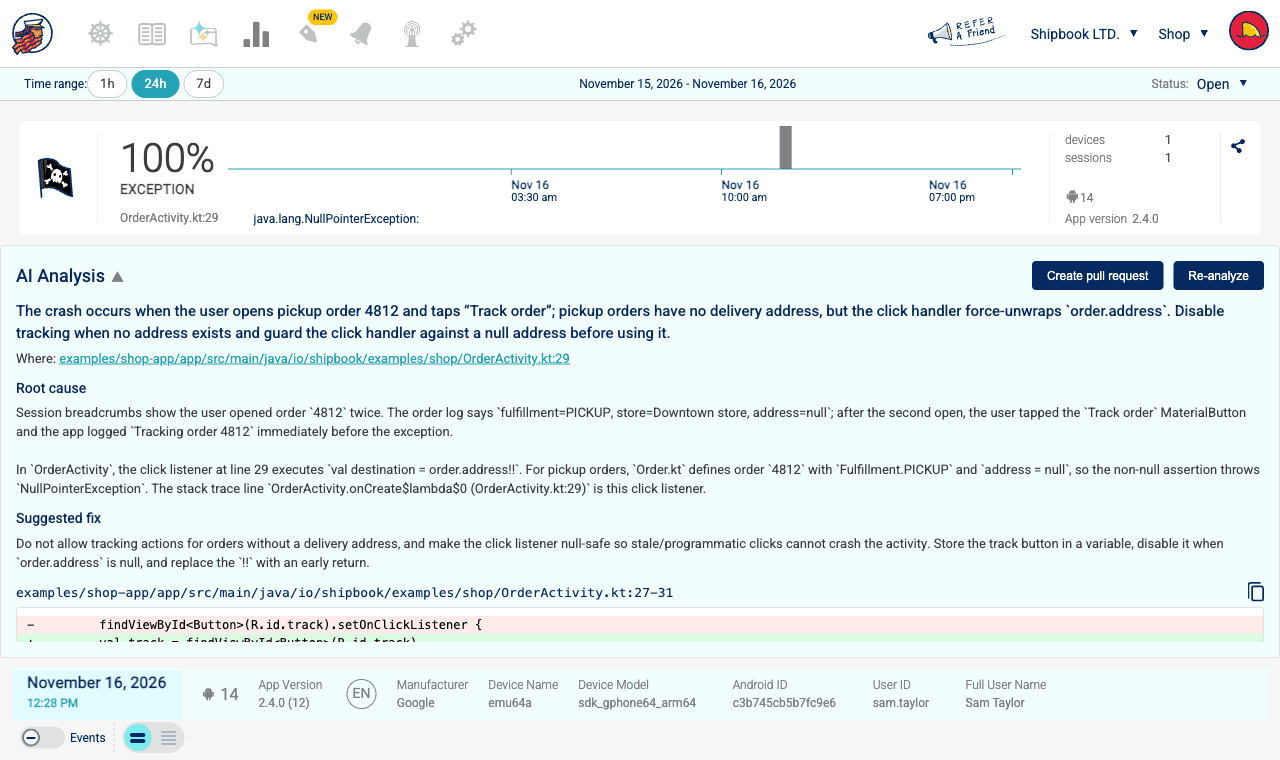
Connect your GitHub repository, open any issue in Loglytics and select Analyze with AI. Shipbook reads the logs that led to the issue and the relevant code in your repository, then shows the exact file and line, the root cause and a suggested fix.
One click on Create pull request opens a pull request with that fix in your repository. You review it, and merge.
When an automatic alert fires, the analysis is already in the email or Slack message.
Real-Time Overview of App Stability
BRIDGE
When an application is released for production, Shipbook gives you a dashboard with a comprehensive overview of all your users, no matter where they are, what app version, or OS they are using.
The Shipbook Bridge features in-depth graphs of system metrics, error logs remotely and usage per app version over time. Switch between hourly, daily or monthly views. See whether errors are occurring in specific app versions as well as user update rates for an extensive picture of actual app stability.
Read moreInstant & Intelligent Alerts
ALERTS
Shipbook ensures your peace of mind by automatically sending alerts to your e-mail or Slack whenever it detects unusual activity or critical errors in your app.
With Shipbook, you'll be the first to know when urgent action is needed, allowing you to address issues swiftly and effectively. So sit back, relax on the beach, and enjoy a refreshing milkshake while Shipbook takes care of detecting issues in your app.
Read moreIntegration with Firebase Crashlytics
Don't limit app monitoring to crashes alone. Firebase Crashlytics won't help for any other issues users may be experiencing. With Shipbook you have visibility of all your app's issues and you can easily integrate Shipbook with Firebase Crashlytics for a comprehensive solution. With one click, view all the logs leading up to the error and uncover why it occurred in the first place.
Why Integrate Shipbook with Firebase Crashlytics?
Get the full picture for all your app's issues without limiting yourself to crashes alone.
Integrating Firebase Crashlytics with Shipbook is fast & simple and will instantly eliminate the guesswork as to the source of the issues.
Fix your code with one easy search and locate the logs of the issue or crash, in context.


INTEGRATIONS
3rd Party Integration
Share the information with your team: Shipbook integrates with both Jira and Slack!
Shipbook sends log text and links from user sessions and issue logs to your team in Jira or Slack, so they can pick up directly where you left off in the console.
Every Shipbook plan has unlimited users, so you can tag your entire team without any problem. Configure automatic alerts so that they are instantly sent to the Slack channel of your choice.
Already logging with another tool? Shipbook works alongside Firebase Crashlytics, SwiftLog and SwiftyBeaver.