Loglytics
Introduction
Shipbook's unique system is proactive and monitors your app performance. Loglytics' algorithm identifies the recurring logs in your app and invites you to fix the issues in your code with a comprehensive list of logs!
Receive automatic alerts directly, so you immediately view and fix issues in real-time, before your users experience them!
Loglytics Main Page
Loglytics is the only platform that compiles a list of recurring logs, which are categorized by the system according to a specific severity.
This list enables the developer to review and fix the issues even when end-users didn't complain.
Log Severity:
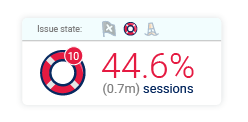
At the top left of the console, you can select the severity that you wish to view.
The number indicates the percent of sessions affected by logs of the selected severity. The grey number below in parentheses indicates the number of sessions affected.
Activity Summary Graph:

At the top of the console is a graph displaying a summary of the activity based on the log severity selected. The time span is indicated above.
This will provide you with a realistic look at the quality of your app.
Reccurring Log List:

The list of recurring logs will be categorized in accordance with the frequency of their recurrence. On the left is the percent of affected sessions for that specific log. In parentheses, the number of sessions is indicated, after which the file name and the row number of the log in the code are displayed.
A sample of the log message text is in the center indicated in blue.
On the right, we have indicated the affected OS versions and the affected app versions.
Loglytics Item Page
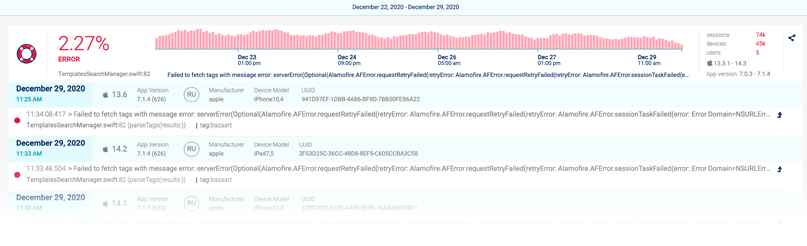
Clicking on any individual log in the Loglytics Main Page will open up a new window with the Loglytics Item Page. The item page displays all the relevant data of the selected recurring log.
This page essentially lists every time that the selected log occurred as well as provides important data metrics on the specific log, enabling you to fix issues faster than ever.
The Loglytics graph shows you exactly at what time, in which app version, what devices etc., the log appeared. The system does the detective work for you, so all the details of the error behavior are at your fingertips.
Example Case Study:
Let's look at the case in the screenshot above where a specific API is not working. On the left, we can see that this error occurs in 2.27 % of user sessions. In the bar graph, you can see that this error occurs pretty steadily, the waves in the graph indicate that there is a slight dip in the afternoon, probably due to user behavior. On the right, we've supplied you with specific metrics, which can act as an aid in identifying the source of the problem. In this case, the error occurs in all app versions that are in use. This is indicative of the fact that there is a problem with the server on a specific API. This problem probably negatively impacts the user experience.
In this case, one simple fix will improve the user experience for over 45k app users.
In other cases where further analysis is necessary, look below the graph to see a list of all the specific cases in which that log occurred.
AI Analysis:
If your account is connected to GitHub and the app is mapped to its repository (see Code Repositories), every issue page includes an AI Analysis panel. Select Analyze with AI and Shipbook reads the relevant code from your repository, then shows where the issue is in the code (with a link to the exact file and line on GitHub), the root cause, and a suggested fix. When an automatic alert fires, this analysis runs on its own and is included in the alert email, Slack message, and webhook.
Issue Statuses
Every recurring issue has a status: Open, Fixed, or Ignored. Change it from the header of the issue page.
- Fixed — mark an issue Fixed once you've shipped the fix. Shipbook automatically remembers the version it was fixed on. If the same issue then appears in a newer version, it is reopened and you get a regression alert — the strongest possible signal that a fix didn't hold. Regression alerts arrive with the AI analysis attached, refreshed for the new occurrence.
- Ignored — for issues you've decided to live with. Ignored issues stop alerting and drop out of your health graphs.
- Open — the default. The Loglytics list shows open issues; use the status filter to see Fixed, Ignored, or all issues.
Alongside regressions, Shipbook also alerts on new issues — the first time an issue is ever seen — by email, Slack, or webhook, with the AI analysis attached.
Each release's new and regressed issue counts also appear on the Releases page, and your AI agent can filter issues by status over MCP.
Go to Session Feature:
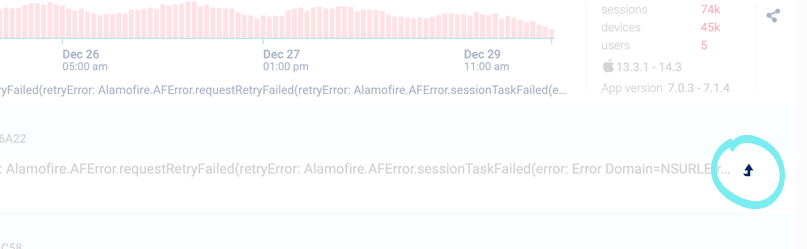
Choosing the “Go to Session” icon (little arrow) to the right of any individual log, will open up the entire session of the log. This will display the logs written chronologically before and after the error occurred, so the specific conditions leading up to the error are easily identifiable.
Alert Feature:
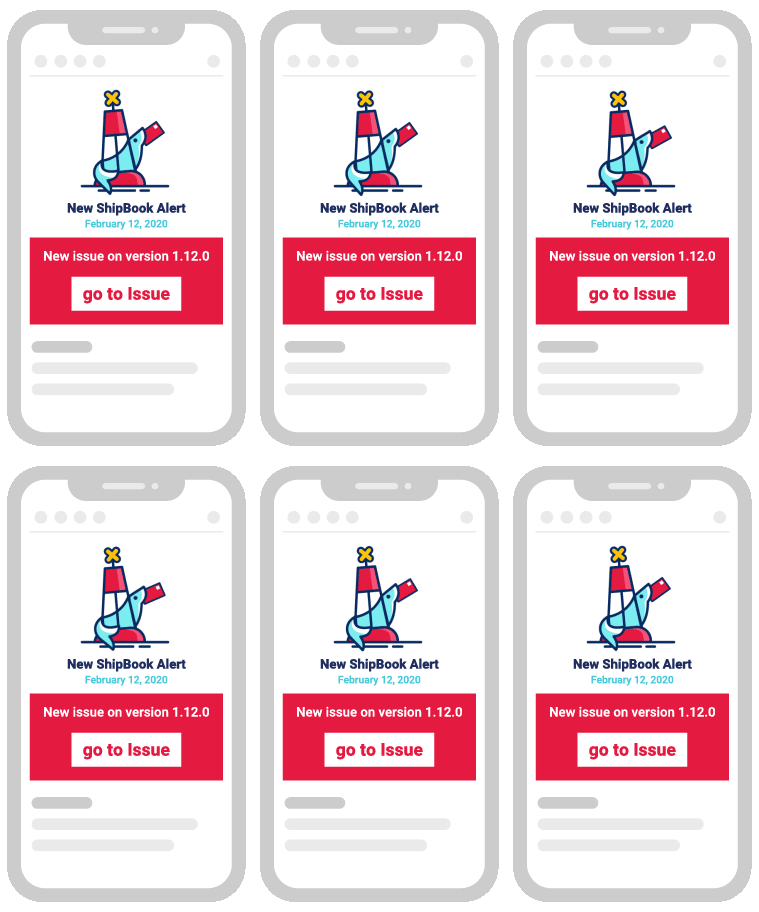
Shipbook will automatically send alerts to your e-mail or Slack in the event that unusual activity or serious errors are detected so that you can rest assured when something urgent is needed you are the first to know.
After selecting "go to issue" in the alert message, Loglytics will open to display a graph similar to the one below, with a clear view of the error and the users it is affecting, as well as with all the tools you need to swiftly resolve the issue.
