
2 posts tagged with "elasticsearch"

View All Tags

· 10 min read
Elisha Sterngold

Dual-write machinery on one side, a single line in time on the other

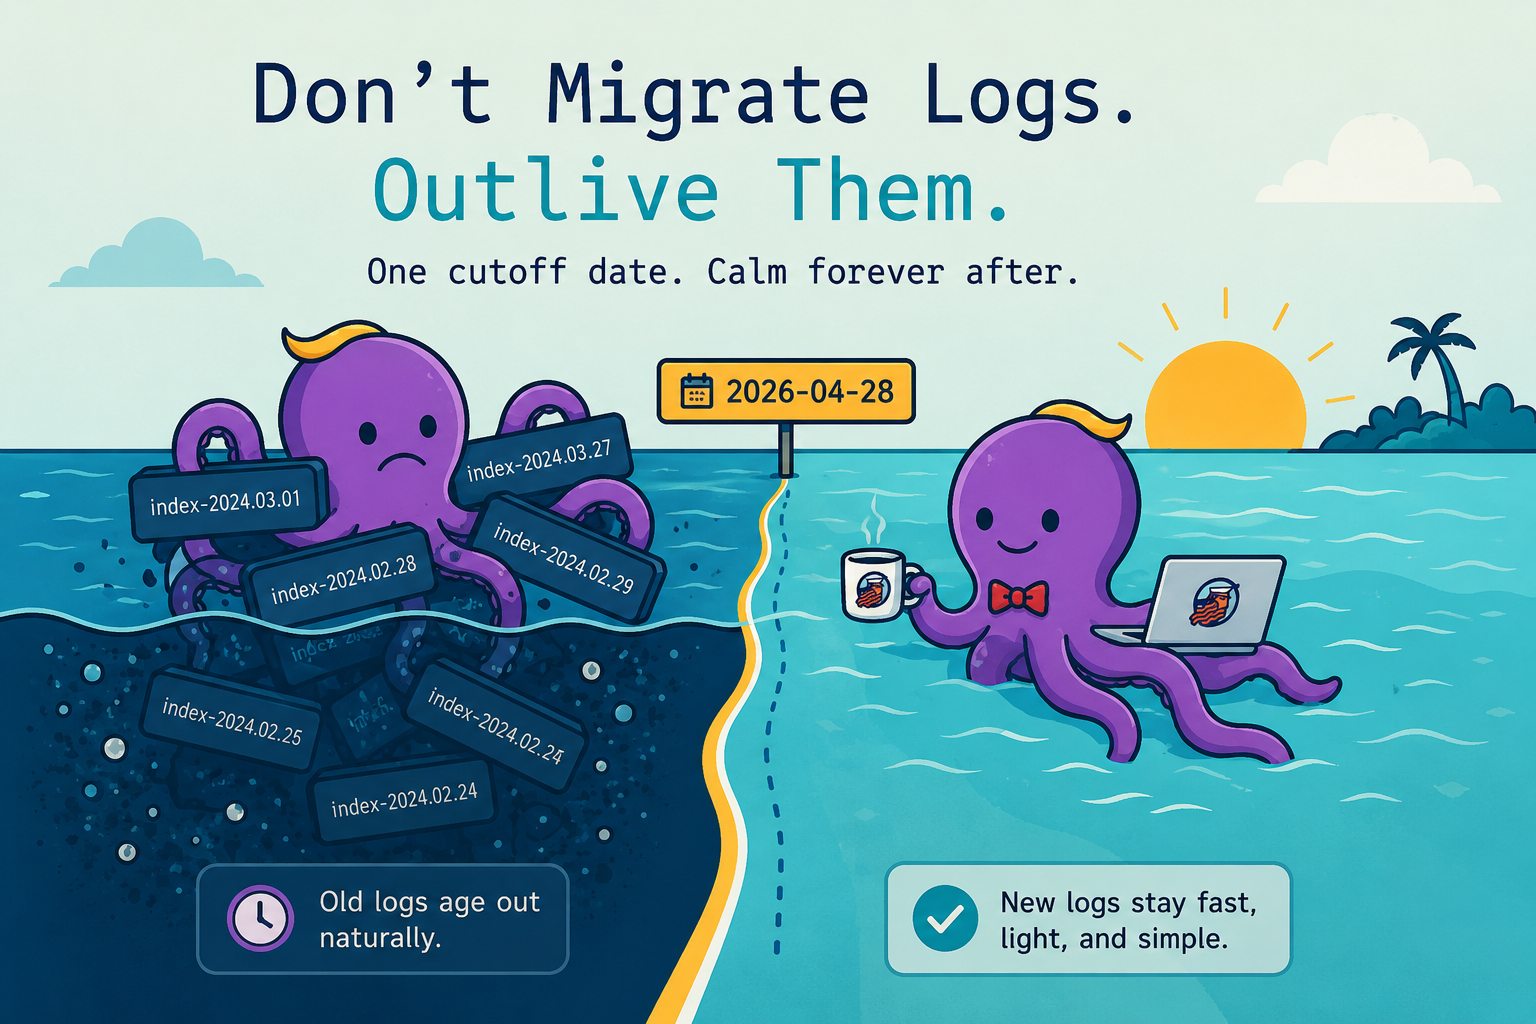
Don't Migrate Logs. Outlive Them.

For two months, every log written into Shipbook was written twice.

Once into the old Elasticsearch cluster, the one we had been running for years. And once, in parallel, into a new one — a different Elasticsearch version, with a completely different way of organizing the data. Dual-write. The standard playbook for moving a database you cannot afford to lose: keep both copies, keep them in sync, prove the new one is right, then flip.

It worked. We are fully on the new cluster now; the old one is gone. But somewhere in the middle of those two months, a much smaller change — one I was forced to handle a completely different way, because dual-write was physically impossible for it — quietly showed me that I had built the entire rest of the migration the hard way.

That smaller change took one line of code and a calendar reminder. The big one took two months of machinery and a steady drip of bugs. They were solving nearly the same problem.

One Dual-Write for Two Changes

I was changing two things at once, and I folded them into a single migration.

The first was the engine: a jump from Elasticsearch 7 to Elasticsearch 9. Years of accumulated reasons — features, a saner storage-tiering model, the end of a version aging out from under us.

The second was the schema. For most of the life of Shipbook — our logging platform — we created one index per customer per day. At our scale that meant thousands of tiny indexes, most nearly empty, all of them taxing the cluster in shard count and metadata churn — the structural problem I wrote about in Driving Our Error Log to Zero. The new shape shares one index across every customer on the same plan, routes writes by account so each customer's data stays together, and gives dedicated indexes only to whale accounts — the handful pushing more than twenty million logs a day.

Both changes went into one dual-write. New cluster, new schema, all at once. Every log landed in the old per-customer index on the old cluster and in the new shared per-plan index on the new one. A backfill job scrolled the entire history across. A flag — readFromNew — kept reads coming from the old, trusted side while the new side filled, ready to flip when I believed it.

That is the textbook approach. The textbook is also where the textbook pain lives.

The Tax on Keeping Two Truths

Dual-write means every write now has two outcomes, and they can disagree.

The secondary write was fire-and-forget — I did not want a hiccup on the new cluster to block a real request on the old one. So when the new cluster pushed back under load, writes to it failed silently. Nothing surfaced, because reads were still served from the healthy old side. The gap only existed on the cluster nobody was reading from yet.

That exact failure became its own story: 1.3 million silent errors a day, accumulating on the secondary side of this very migration, invisible to every customer. It was future damage — fuel loading quietly behind a flag, waiting for the day reads flipped over to detonate as missing sessions and stale fields. We caught it only because Claude could read the production logs and a number on a histogram did not fit the story.

That is the dual-write tax. You are not running one system; you are running two systems and a promise that they match. Every write path carries a branch. Every error makes you ask which cluster it came from. The whole apparatus exists to keep two copies of the truth in sync — and keeping two copies of the truth in sync is one of the genuinely hard problems in computing. We paid the tax for two months. The commit that finally deleted the old cluster's code path is dated almost two months after the one that added the dual-write.

The One Change I Couldn't Dual-Write

In the middle of all that, I needed to add routing to the new per-plan indexes — to tell Elasticsearch to place every account's logs together on the same shard, so a query for one customer hits one shard instead of fanning out across all of them.

And I could not dual-write it. Not because of effort — because it is impossible. Routing is decided at the instant a document is written; it determines which shard the document physically lands on. The logs already written to the new indexes were already placed, scattered across shards by their id. There is no second write that fixes where the first one went. My only options were to reindex everything — expensive, and exactly the kind of bulk data movement I was trying to avoid — or to draw a line.

So I drew a line. One constant:

private static readonly RET_ROUTING_TEMPLATE_CUTOVER = '2026-04-28';

Indexes created before that date are read the old way, without routing assumptions. Indexes created on or after it carry routing. The reader checks the date in the index name and does the right thing for each. And then — because every log has a retention and a nightly job deletes the ones past it — the pre-cutover indexes simply age out. A thirty-day index is gone thirty days later. Once the last one expires, the special case is dead code.

// TODO ~2026-05-28: drop the 30d guard once pre-cutover indexes age out.

That TODO is the entire decommission plan. Not a migration. A reminder. No second write, no backfill, no flag to flip, no held breath. The only cost was patience: for a few weeks, some reads spanned both the old and new index shapes before the old ones evaporated.

It was so much calmer than the thing happening all around it that I almost did not notice it was the same kind of problem.

Where Claude Helped, and Where It Led Me Astray

I did this work in a tight loop with Claude Code, and the honest accounting cuts both ways.

It earned its keep on the hard, fiddly parts. The hot/warm storage tiering — recent data on fast NVMe, older indexes rolled down to cheaper disk — it designed cleanly. When the new per-plan indexes started rejecting writes every midnight, it worked out why: routing by account funneled a burst of high-volume accounts onto one shard the instant each fresh daily index appeared. And it caught a missing shards-per-node cap that had piled a whale's ten shards onto two machines.

It also walked me into walls with total confidence.

It opened by reasoning about Elasticsearch 7 — because it saw 7.17 in our package.json. That was the client library; the cluster was already on 9. Half its early advice applied to a system we no longer ran.

It recommended an index setting to read each index's age from its name. Reasonable, except Elasticsearch's date parser wants hyphens and our names use underscores. It did not fail in review. It failed in production, on all 325 existing indexes at once, every one stuck in an error state until I tore the setting back out by hand.

And for a stretch it argued against the hot/warm tiering I wanted — insisting it would not come out ahead, that there was nothing to gain. The argument rested on a cost calculation, and the calculation was simply wrong: my configuration cost the same either way, and the tiered shape was the right one for the workload. Not a defensible judgment built on a real number — a wrong number, stated with exactly the confidence of a right one.

The lesson is the one from every post I write about this: a confident wrong number reads identically to a confident right one. The model will reason beautifully and calculate badly in the same breath, and my job is to make it show the arithmetic before I act on the conclusion.

And the decision itself stays mine. The model can fetch, calculate, and propose — but the moment you let Claude, or any AI, do the deciding, you have handed the wheel to something that is wrong and right with the same face, and it will walk you off a cliff with perfect composure. For the moment, at least, that is the one job you do not delegate.

What I'd Do Differently

The routing change was forced into the cheap approach. I did not choose the cutoff date because it was elegant; I chose it because dual-write was off the table. And the forced move turned out to be the one I should have made everywhere.

If I ran the cluster migration again, I would not dual-write it. I would give it a cutoff date too. Stand up the new cluster, point new writes at it, leave the old cluster running and serving the logs it already holds. Read from both during the overlap and merge. Then wait — and the day the oldest log on the old cluster passes its retention, the old cluster holds nothing anyone needs, and you switch it off.

No second copy of the truth to keep in sync. No backfill dragging the whole history across the wire. No silent secondary-write failures loading future damage behind a flag. The price is real and worth naming: you keep two clusters running for as long as your longest retention tier — up to a hundred and eighty days for us — instead of cutting over in a weekend. For a dataset that deletes itself, that is almost always the cheaper trade.

I reached for dual-write because that is what you reach for when you migrate a database. But logs are not most databases. They expire. The hard part of a migration is usually moving the history — and with logs there is no history to move, only a present that, left alone, becomes the past and then becomes nothing.

The Dull Work Customers Could Feel

I have spent this whole post second-guessing how I ran the migration. I want to be just as clear about the thing I do not second-guess: running it at all.

After the new infrastructure settled, the feedback started arriving on its own — from several customers, unprompted. The server feels faster. Searches come back quicker. Nobody files a support ticket asking you to reorganize your Elasticsearch indexes — but the speed-up was real enough that they noticed it on their own and told us.

That is the part worth holding onto. Infrastructure work is the least glamorous work there is. It ships no feature, closes no requested ticket, and shows up on no roadmap anyone cheers for. It is dull — right up until you discover that the dull work was what everything visible had been quietly resting on the whole time. The plumbing is invisible until someone notices the water is suddenly faster out of the tap. The schema change I almost talked myself out of as not-worth-it turned out to be something paying customers could feel.

So both things are true at once. I would change how I did it. I would not, for a second, change that I did it.

The one change I could not force into the dual-write was the one that told me the truth. Next time I will draw the line first.
· 10 min read
Elisha Sterngold

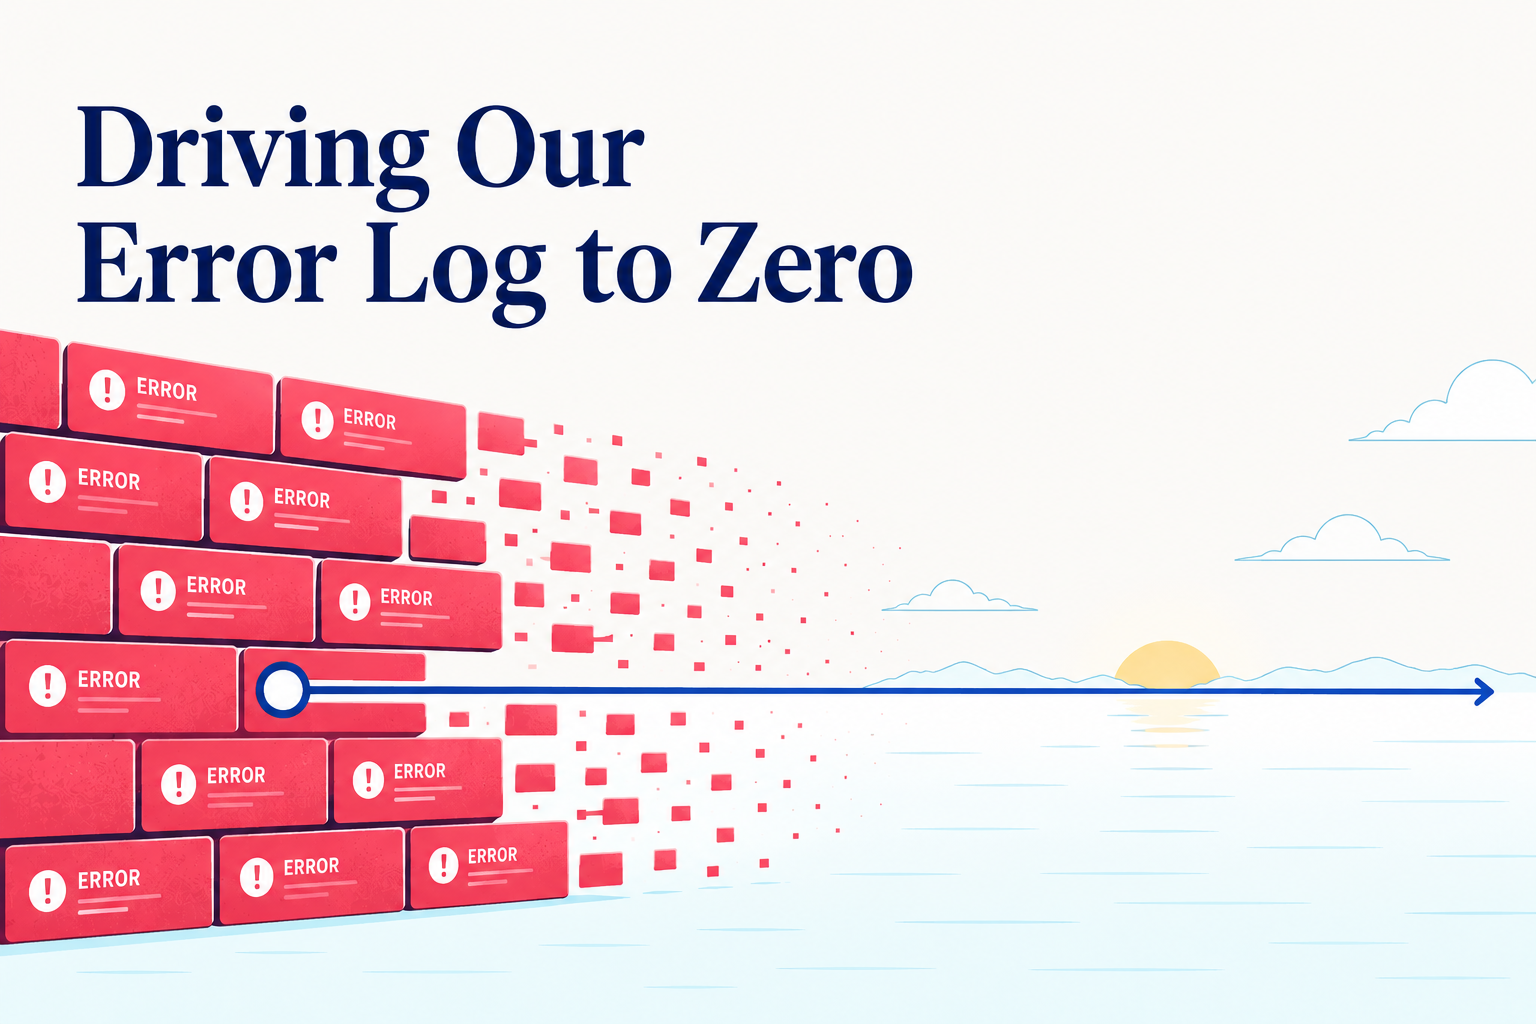
From a wall of red errors to a near-zero baseline

Driving Our Error Log to Zero (Without a Single Customer Complaint)

The Shipbook server's error log was full. Bright red, thousands of errors a day, some hours hitting a wall.

Not a single customer had complained.

That should already be the strange part. Most teams treat "no support tickets" as the only signal that matters. If users are not complaining, the system is fine. Move on. There is always something more urgent than cleaning up a log nobody is looking at.

I do not think that is true. And the month I just spent driving our error log down to zero — with no one asking me to, and ending up redesigning a chunk of our Elasticsearch architecture I had not planned on touching — is the reason I do not think that.

What a Crowded Error Log Actually Costs You

The first thing a noisy error log costs you is the ability to read it. When the page is red, every error is a red error. The genuinely scary one — the one that should be paging someone at three in the morning — is sitting in the same color and the same font and the same row as four hundred other lines that mean nothing.

You stop scanning. You stop trusting. After a while you stop opening the page at all. The log becomes wallpaper, and your production system goes dark.

The second thing it costs you is harder to see, and it is the actual reason I went after this. Every error line is a signpost. Behind the line is real misbehavior — a retry the server should never have attempted, a background job queued for an already-invalid request, a chain of work that ran for seconds before something deep inside realized the whole exercise was doomed. The log is not the cost. The log is the marker. The cost is everything the server kept doing because something was wrong and nothing stopped it. Sum that up across thousands of errors a day and you start to notice numbers you would rather not be paying for. CPU. Memory. Bandwidth. Database writes that never get read. Threads tied up on requests that were never going to succeed.

You Cannot Fix What You Cannot See

For most of Shipbook's life I could not have done this work at all, because we were not running Shipbook on ourselves. Our SDKs covered every mobile surface our customers used — iOS, Android, Flutter, React Native — but our own Node.js backend was wired to a generic logger. A few months ago we fixed that and built a Shipbook Node SDK, a story I wrote separately in Why We Started Dogfooding Shipbook. What mattered for this story is what changed once the server's logs were flowing into Shipbook: the shape and size of the problem became visible. Sessions, timestamps, stack traces — all in the same console our customers had been using all along.

That alone was not enough. The volume was still the thing that defeated me — every time I opened the error page I had to choose between scrolling through thousands of nearly-identical lines or just closing the tab.

The thing that broke the deadlock was Loglytics. Our own product — the error analytics layer that sits on top of Shipbook. It does the boring work I had been failing to do: group every error by its template, count how often it occurs, rank it by frequency, attach it to the sessions it touched.

What had been a wall of red became a list of about twenty distinct patterns. Two of them accounted for most of the volume. A handful more added a long tail. I could see the shape of the problem for the first time.

There is no version of this work that gets done without a classifier. If you cannot collapse "two thousand individual errors" into "five patterns occurring at these rates," you cannot triage — you can only despair. The categorization is not a nice-to-have on top of logging. It is the thing that makes the cleanup possible.

Every Error Gets a Verdict

With the list in hand, I started going through it one entry at a time. Each one got a verdict.

It is tempting to imagine this is fast. It is not. Every pattern requires opening the code, finding the path that emits the log, understanding the condition that triggered it, and deciding what the right severity is. The verdicts fell into three buckets, and the third is where most of the work hid.

Some errors were not errors. A "session not found" warning was firing whenever a request hit an old Elasticsearch index that predated a schema change we had made months earlier — historical data that did not have a field the new code expected. Demoting to debug was the obvious move, but I scoped the demotion to indexes older than the fix date. Newer indexes still raise the warning, because there a missing field really is a bug.

Some errors were sometimes errors. This was the subtle case. One pattern turned out to be a specific customer's app sending malformed exception payloads from an SDK version that had a known bug. Demoting it globally was wrong — the same log line, fired by any other client, was a real error and we needed to know about it. What we wanted was: if the app is X and the version is Y, demote to debug; otherwise, keep it as a warning. So that is what the code now does. The verdict is conditional on context, not on the log line.

Some errors were real errors. Those got fixed.

The temptation in the middle bucket is to take the shortcut: downgrade everything, walk away, declare victory. I went out of my way not to do that. A log line that is sometimes a real bug and sometimes noise is the most dangerous kind of log line, because once you silence it you have silenced the case you wanted to hear about. The work of writing the conditional — of saying "this is noise only in this exact circumstance" — is the work that keeps the signal alive.

The Architecture Was the Bug

Several of the patterns were not code bugs at all. They were Elasticsearch telling me that the way I had asked it to store data was wrong.

The biggest tell was a recurring set of connection errors against the cluster — failures, retries, timeouts — the kind of thing you assume is a flaky network until the same shape appears day after day. The choice underneath was years old and had never been revisited: we were creating one Elasticsearch index per customer per day. At our current scale that meant tens of thousands of tiny indexes, most of them holding almost nothing, all of them costing the cluster in connection overhead, shard count, and metadata churn. The cluster was not breaking under load. It was breaking under the weight of its own structure.

That insight forced the redesign. The errors had pointed at the real problem, and fixing it required a different schema. Customers on the same plan would share an index instead of each getting one a day. Our largest customers — what we call whale accounts — still got their own index, so searches against their data stayed fast, with sharding distributing that index across the dedicated infrastructure we had provisioned for them. Finding the right balance — large enough that the cluster is not buried in metadata, small enough that one customer's data does not drown another's — was exactly the hard part. ILM came in alongside the new schema, with a hot tier holding only the indexes that were actually hot and a nightly job rolling older ones down to warm, instead of letting every index sit forever on the same expensive nodes.

The new strategy rolled out and a fresh wave of errors appeared the next morning — old ones the previous structure had been quietly papering over. The most surprising side effect arrived a couple of days later, when I looked at the cluster's CPU graph and realized it had collapsed. We had been carrying a fleet of nodes sized for the old metadata churn. Once the writes settled into the new shape and the errors stopped firing, the question became: did I even need this many machines? The honest answer was no.

The Cheaper, Calmer Server

The other half of the work was on our own code paths.

The SDK sends userInfo on every batch upload — that is how the API works. The bug was on our side: the server was treating each of those uploads as a fresh write to Elasticsearch, whether the user info had actually changed or not. A skip-if-unchanged check at the entry point now lets the vast majority of those uploads land, see nothing new, and bail out before touching the database. A real slice of our ES write traffic disappeared with them.

A few error paths were doing too much in the other direction. They would kick off a chain of background work — looking things up, retrying, queueing follow-up jobs — only to discover several steps in that the input was invalid and the whole chain should be abandoned. Moving validation to the front of those paths meant the server bailed out in microseconds instead of seconds. Threads stopped getting tied up on doomed requests. The load came down.

None of this would have happened without being forced to go through the error log line by line. The cleanup was the excuse. The performance and cost gains were the side effect — and they more than paid for the work.

What Zero Buys You

The error log on the Shipbook server is now near zero. Not literally zero — there is always something — but small enough that when a new pattern shows up I see it the same day, because it is no longer hiding inside a wall of other red.

That is the real prize. Not the lower bill, although I will take the lower bill. Not the calmer server, although I will take the calmer server. The prize is that the log finally tells the truth. When it goes red now, it means something. The signal is back.

Nobody asked me to do this work, and no end user would have noticed if I had not done it. That is the case I want to make. The most valuable bugs to catch are the ones that have not yet hurt anyone. The most valuable logs to fix are the ones nobody is yet reading. Waiting until customers complain is waiting too long, because by then the damage has crossed from your infrastructure into someone else's afternoon.

You will not get there without a classifier. You will not get there in an afternoon. You will not get there by bulk-downgrading every noisy line. But you can get there, and when you do, you will find that the server you have been running is actually two or three different servers — the one that does the real work, the one that does pointless work, and the one that exists only to log that the pointless work failed. Drive the noise out, and what is left is the one you wanted all along.