
3 posts tagged with "claude"

View All Tags

· 10 min read
Elisha Sterngold

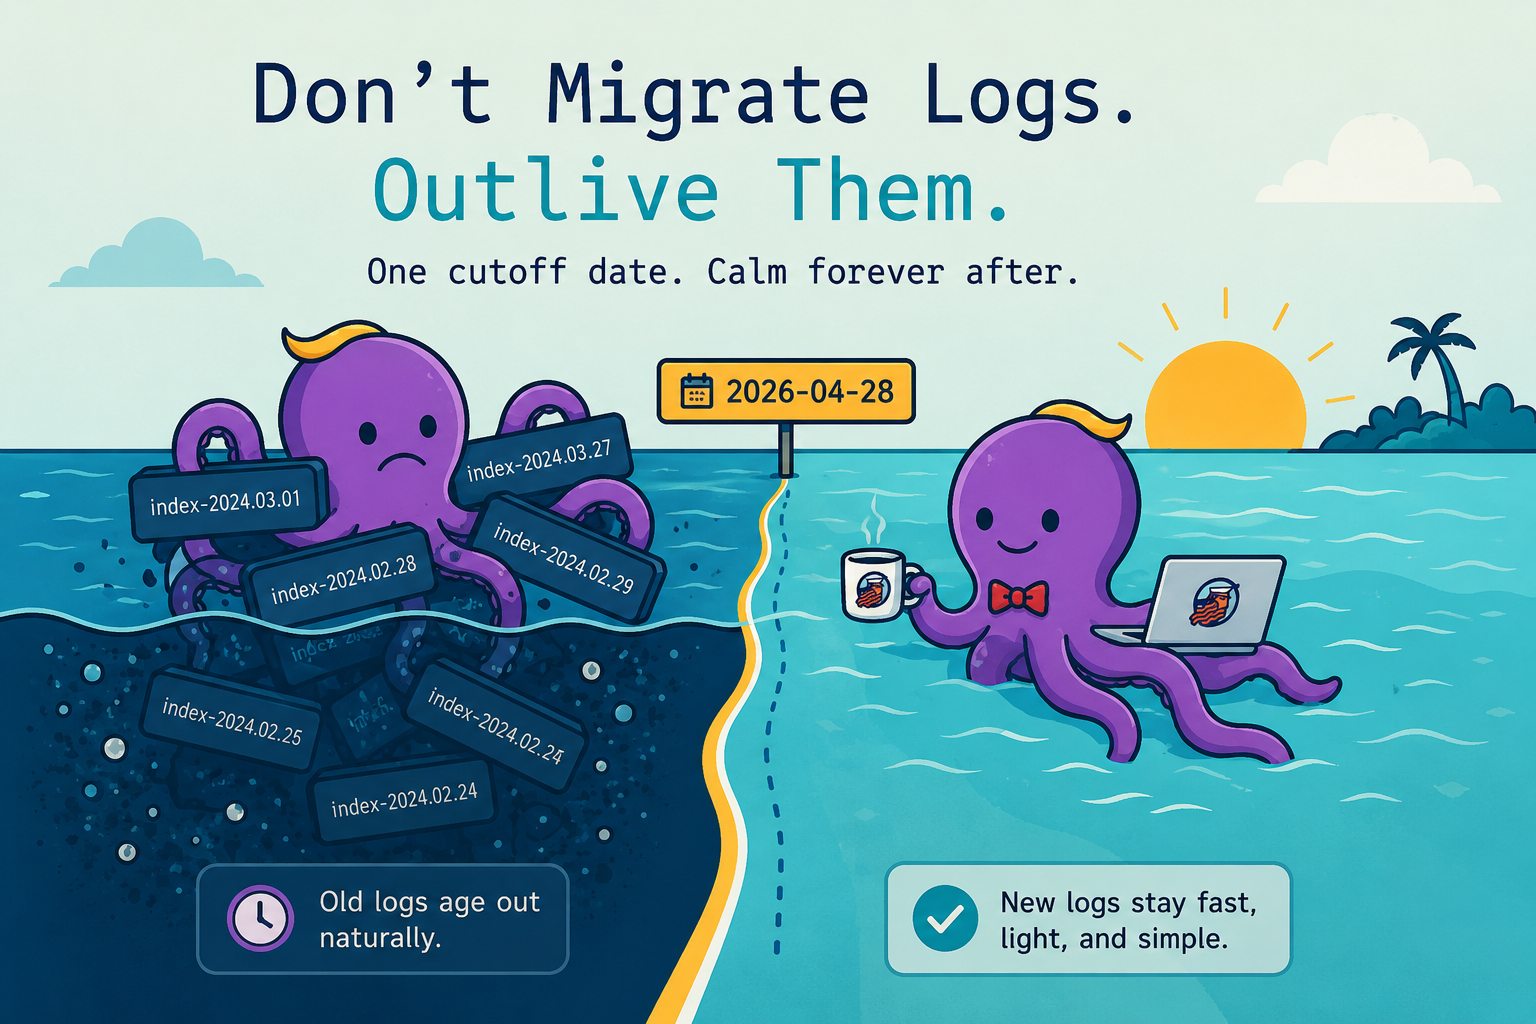
Dual-write machinery on one side, a single line in time on the other

Don't Migrate Logs. Outlive Them.

For two months, every log written into Shipbook was written twice.

Once into the old Elasticsearch cluster, the one we had been running for years. And once, in parallel, into a new one — a different Elasticsearch version, with a completely different way of organizing the data. Dual-write. The standard playbook for moving a database you cannot afford to lose: keep both copies, keep them in sync, prove the new one is right, then flip.

It worked. We are fully on the new cluster now; the old one is gone. But somewhere in the middle of those two months, a much smaller change — one I was forced to handle a completely different way, because dual-write was physically impossible for it — quietly showed me that I had built the entire rest of the migration the hard way.

That smaller change took one line of code and a calendar reminder. The big one took two months of machinery and a steady drip of bugs. They were solving nearly the same problem.

One Dual-Write for Two Changes

I was changing two things at once, and I folded them into a single migration.

The first was the engine: a jump from Elasticsearch 7 to Elasticsearch 9. Years of accumulated reasons — features, a saner storage-tiering model, the end of a version aging out from under us.

The second was the schema. For most of the life of Shipbook — our logging platform — we created one index per customer per day. At our scale that meant thousands of tiny indexes, most nearly empty, all of them taxing the cluster in shard count and metadata churn — the structural problem I wrote about in Driving Our Error Log to Zero. The new shape shares one index across every customer on the same plan, routes writes by account so each customer's data stays together, and gives dedicated indexes only to whale accounts — the handful pushing more than twenty million logs a day.

Both changes went into one dual-write. New cluster, new schema, all at once. Every log landed in the old per-customer index on the old cluster and in the new shared per-plan index on the new one. A backfill job scrolled the entire history across. A flag — readFromNew — kept reads coming from the old, trusted side while the new side filled, ready to flip when I believed it.

That is the textbook approach. The textbook is also where the textbook pain lives.

The Tax on Keeping Two Truths

Dual-write means every write now has two outcomes, and they can disagree.

The secondary write was fire-and-forget — I did not want a hiccup on the new cluster to block a real request on the old one. So when the new cluster pushed back under load, writes to it failed silently. Nothing surfaced, because reads were still served from the healthy old side. The gap only existed on the cluster nobody was reading from yet.

That exact failure became its own story: 1.3 million silent errors a day, accumulating on the secondary side of this very migration, invisible to every customer. It was future damage — fuel loading quietly behind a flag, waiting for the day reads flipped over to detonate as missing sessions and stale fields. We caught it only because Claude could read the production logs and a number on a histogram did not fit the story.

That is the dual-write tax. You are not running one system; you are running two systems and a promise that they match. Every write path carries a branch. Every error makes you ask which cluster it came from. The whole apparatus exists to keep two copies of the truth in sync — and keeping two copies of the truth in sync is one of the genuinely hard problems in computing. We paid the tax for two months. The commit that finally deleted the old cluster's code path is dated almost two months after the one that added the dual-write.

The One Change I Couldn't Dual-Write

In the middle of all that, I needed to add routing to the new per-plan indexes — to tell Elasticsearch to place every account's logs together on the same shard, so a query for one customer hits one shard instead of fanning out across all of them.

And I could not dual-write it. Not because of effort — because it is impossible. Routing is decided at the instant a document is written; it determines which shard the document physically lands on. The logs already written to the new indexes were already placed, scattered across shards by their id. There is no second write that fixes where the first one went. My only options were to reindex everything — expensive, and exactly the kind of bulk data movement I was trying to avoid — or to draw a line.

So I drew a line. One constant:

private static readonly RET_ROUTING_TEMPLATE_CUTOVER = '2026-04-28';

Indexes created before that date are read the old way, without routing assumptions. Indexes created on or after it carry routing. The reader checks the date in the index name and does the right thing for each. And then — because every log has a retention and a nightly job deletes the ones past it — the pre-cutover indexes simply age out. A thirty-day index is gone thirty days later. Once the last one expires, the special case is dead code.

// TODO ~2026-05-28: drop the 30d guard once pre-cutover indexes age out.

That TODO is the entire decommission plan. Not a migration. A reminder. No second write, no backfill, no flag to flip, no held breath. The only cost was patience: for a few weeks, some reads spanned both the old and new index shapes before the old ones evaporated.

It was so much calmer than the thing happening all around it that I almost did not notice it was the same kind of problem.

Where Claude Helped, and Where It Led Me Astray

I did this work in a tight loop with Claude Code, and the honest accounting cuts both ways.

It earned its keep on the hard, fiddly parts. The hot/warm storage tiering — recent data on fast NVMe, older indexes rolled down to cheaper disk — it designed cleanly. When the new per-plan indexes started rejecting writes every midnight, it worked out why: routing by account funneled a burst of high-volume accounts onto one shard the instant each fresh daily index appeared. And it caught a missing shards-per-node cap that had piled a whale's ten shards onto two machines.

It also walked me into walls with total confidence.

It opened by reasoning about Elasticsearch 7 — because it saw 7.17 in our package.json. That was the client library; the cluster was already on 9. Half its early advice applied to a system we no longer ran.

It recommended an index setting to read each index's age from its name. Reasonable, except Elasticsearch's date parser wants hyphens and our names use underscores. It did not fail in review. It failed in production, on all 325 existing indexes at once, every one stuck in an error state until I tore the setting back out by hand.

And for a stretch it argued against the hot/warm tiering I wanted — insisting it would not come out ahead, that there was nothing to gain. The argument rested on a cost calculation, and the calculation was simply wrong: my configuration cost the same either way, and the tiered shape was the right one for the workload. Not a defensible judgment built on a real number — a wrong number, stated with exactly the confidence of a right one.

The lesson is the one from every post I write about this: a confident wrong number reads identically to a confident right one. The model will reason beautifully and calculate badly in the same breath, and my job is to make it show the arithmetic before I act on the conclusion.

And the decision itself stays mine. The model can fetch, calculate, and propose — but the moment you let Claude, or any AI, do the deciding, you have handed the wheel to something that is wrong and right with the same face, and it will walk you off a cliff with perfect composure. For the moment, at least, that is the one job you do not delegate.

What I'd Do Differently

The routing change was forced into the cheap approach. I did not choose the cutoff date because it was elegant; I chose it because dual-write was off the table. And the forced move turned out to be the one I should have made everywhere.

If I ran the cluster migration again, I would not dual-write it. I would give it a cutoff date too. Stand up the new cluster, point new writes at it, leave the old cluster running and serving the logs it already holds. Read from both during the overlap and merge. Then wait — and the day the oldest log on the old cluster passes its retention, the old cluster holds nothing anyone needs, and you switch it off.

No second copy of the truth to keep in sync. No backfill dragging the whole history across the wire. No silent secondary-write failures loading future damage behind a flag. The price is real and worth naming: you keep two clusters running for as long as your longest retention tier — up to a hundred and eighty days for us — instead of cutting over in a weekend. For a dataset that deletes itself, that is almost always the cheaper trade.

I reached for dual-write because that is what you reach for when you migrate a database. But logs are not most databases. They expire. The hard part of a migration is usually moving the history — and with logs there is no history to move, only a present that, left alone, becomes the past and then becomes nothing.

The Dull Work Customers Could Feel

I have spent this whole post second-guessing how I ran the migration. I want to be just as clear about the thing I do not second-guess: running it at all.

After the new infrastructure settled, the feedback started arriving on its own — from several customers, unprompted. The server feels faster. Searches come back quicker. Nobody files a support ticket asking you to reorganize your Elasticsearch indexes — but the speed-up was real enough that they noticed it on their own and told us.

That is the part worth holding onto. Infrastructure work is the least glamorous work there is. It ships no feature, closes no requested ticket, and shows up on no roadmap anyone cheers for. It is dull — right up until you discover that the dull work was what everything visible had been quietly resting on the whole time. The plumbing is invisible until someone notices the water is suddenly faster out of the tap. The schema change I almost talked myself out of as not-worth-it turned out to be something paying customers could feel.

So both things are true at once. I would change how I did it. I would not, for a second, change that I did it.

The one change I could not force into the dual-write was the one that told me the truth. Next time I will draw the line first.
· 9 min read
Elisha Sterngold

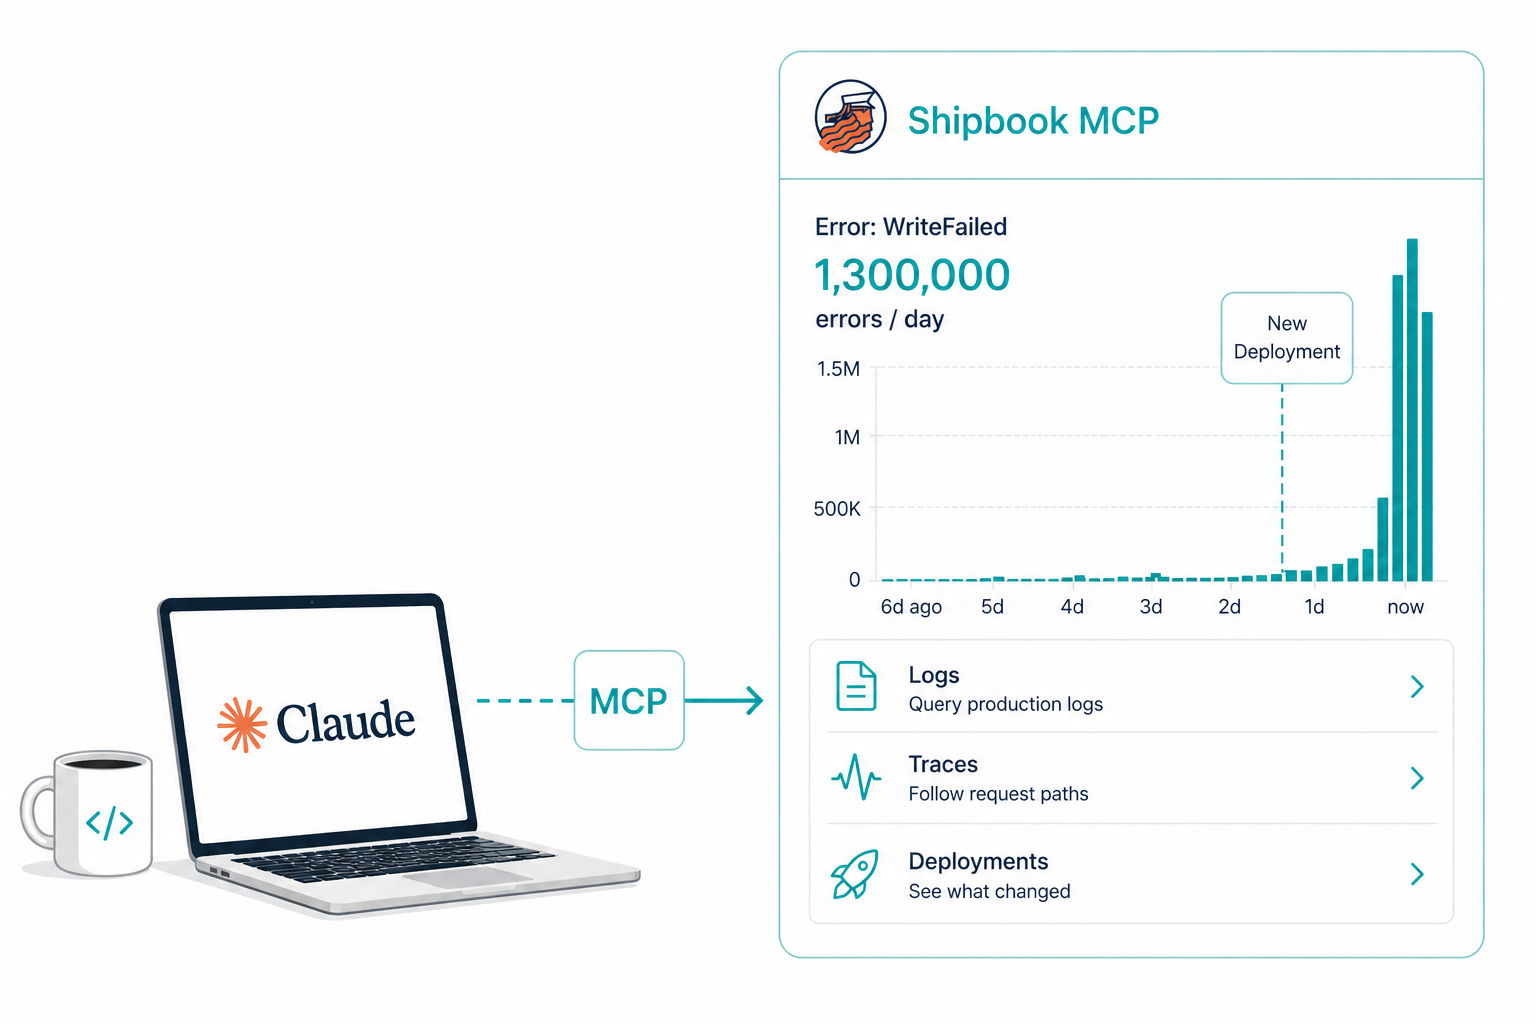
Claude querying production logs through the Shipbook MCP

The Bug Hiding in Our Logs That AI Almost Helped Us Miss

A unit test was timing out on my laptop. The kind of small annoyance you push to next week. I asked Claude to look at it.

A couple of hours later we had a fix. We also had something I did not expect: confirmation that the same bug, in a slightly stricter form, had been firing 1.3 million times a day in production for the past day and a half — silently, in a fire-and-forget error path nobody was watching.

The fix is uninteresting. The way we got there is the part worth writing about.

The Hypothesis That Sounded Small

While Claude was poking at the local failure, it offered a guess about the production impact. The buggy code path was reached only by a couple of background jobs, it said. Bounded scope. The kind of thing you fix in the next deploy window, not at midnight.

It was a confident answer. Two callers. Job tier. Done. Claude did add a passing line at the end — "worth grepping production logs to confirm" — but it landed the way most footnotes land: as a thing you nod at and move on from. The whole framing pointed away from urgency.

I almost moved on. The fix was ready, the tests were green, and there was nothing in the model's analysis that suggested otherwise. What I did instead — and this is the only thing I want to take credit for in this whole story — was not accept the confident answer. I told Claude to actually check. Pull the production logs. See if the bug was, in fact, contained.

That single sentence is the difference between this story and the much more boring version of it. Claude had given me a tidy diagnosis. The diagnosis was wrong. And the only reason I knew to push back is that I have learned, slowly and at some cost, that "bounded scope" answers from a confident model are exactly where I should be most suspicious. Not because the model is reckless. Because confident reasoning in the absence of data is just well-formed guessing.

So Claude called the Shipbook MCP and pulled a seven-day histogram of the relevant error.

The histogram looked like a wall. Six errors a day. Six. Four. Three. Six. Then a cliff. Then 1.3 million.

A number that high cannot come from a job that runs every five minutes. The original "background jobs only" story was wrong, and it was wrong by an order of magnitude that none of us — engineer or model — would have inferred from the code alone. The cliff also lined up exactly with a constant in our own code that had switched on stricter behavior in our new infrastructure. The story was no longer "small bounded bug." It was "we have been silently breaking writes to a whole cluster since the moment we deployed that constant, and we did not know."

The MCP did not just confirm a hypothesis. It overturned a benign one and replaced it with a real one.

What the Tight Loop Actually Buys You

I want to be careful about what is new here, because plenty of tools claim some version of "AI debugs production." Most of them are wrong.

What is new is not that an AI can look at logs. It is that the model can stay inside its hypothesis-and-test loop without leaving the conversation. The engineer's job, in that loop, is no longer to fetch data. It is to decide which questions are worth asking. The model handles the rest.

The volume on that histogram did not just upgrade the priority of the bug. It corrected the model. With the number on the table, Claude re-read the code, found a caller it had missed — on the request path of every active session — and revised its picture of the situation. The interesting thing is not that the model corrected itself, but what corrected it. It was not better reasoning. It was a number that did not fit the story. A model that cannot see production will keep telling stories that do not survive contact with it. A model that can see production gets caught when it is wrong, and updates.

This is the loop we are betting on: the model proposes, the data disposes, and both stay in the same conversation while it happens.

Two Bugs for the Price of One

While we were already inside the data, we noticed something we had not gone looking for. The first bug had been masking a second one. A customer we had recently promoted to a higher tier was supposed to have their traffic distributed across several pieces of dedicated infrastructure. Because of a related routing decision, all of their traffic had been piling onto one of those pieces, with the others sitting empty.

We would have caught this eventually. Probably the next time someone looked at a latency dashboard and noticed an asymmetry. Probably weeks from now. We caught it today, because we were already there. It cost us one extra question.

This is, I think, an underrated effect of having a low-friction loop. When the cost of looking is low, you look more. When you look more, you find things you would not have specifically gone hunting for. Cheap curiosity compounds.

Logs Nobody Queries Are Not Insight

The bug that bled 1.3 million times a day was logged faithfully. Every single error was caught, formatted, written out — and ignored. It was not in a dashboard. It did not page anyone. The error path was deliberately fire-and-forget, because the alternative would have been a request-blocking failure mode that we did not want.

A log no one queries is closer to a tree falling in an empty forest than to information. It exists, but it does not act on the world. Most production systems are full of these. We have built a generation of observability tools that are excellent at producing logs and mediocre at producing attention.

The interesting question is not "how do we collect more logs." It is "how do we make the logs that already exist legible to the people, or the agents, who can do something about them."

Ground Truth and the Model

There is a thing AI systems are bad at, which is making confident claims about specific facts they cannot verify. There is a thing they are good at, which is reasoning over data once that data is in front of them.

The trick is to put the data in front of them. Not as a paragraph in a prompt — as a tool call. Not as yesterday's snapshot — as live state. The model should not be guessing what production looks like; it should be looking.

That is what an MCP server does. It turns whatever capability you wire up — logs, in this case — into a function the model can call when it decides it needs the answer. The model's reasoning is no longer floating; it is anchored to whatever ground truth you have given it access to.

We have spent the last few months wiring our own product into our own conversations. Our logs sit a tool call away from Claude. So do our deployments, our error analytics, our session traces. The result is not magic. It is something quieter and more useful: an engineer and an agent, looking at the same reality at the same time, and reasoning about it together.

The Footnote That Matters

There is one more thing worth saying, because it is the most honest part of the story. No end user was affected by any of this.

The cluster where the writes were failing was the new one — the secondary side of an in-progress migration. Reads were still being served from the original cluster, which was healthy and complete. The 1.3 million errors a day were silently accumulating inside our own infrastructure, on a side of the system no customer was reading from. To anyone using Shipbook today, everything looked fine. It was fine.

The damage was strictly future damage. The day we cut over reads to the new cluster, every one of those failed updates would have surfaced as a missing field, a stale session, a piece of context that should have been there and was not. The bug was a quiet, slow accumulation of data drift that would have detonated the moment we trusted the new cluster.

I almost did not include this section because it felt like deflating the drama. But it is actually the point. The most valuable bugs to catch are the ones that are not yet on fire — the ones that are loading their fuel quietly, behind a flag, on a path nobody is yet looking at. Those are the ones that turn into postmortems six months later, when the team has forgotten the context and the data is unrecoverable.

We did not catch a customer-facing crisis today. We caught the seed of one, while it was still small enough to fix in an afternoon. That is the kind of catch a tight loop with production data makes possible. Not heroic firefighting. Just earlier noticing.

The Quiet Lesson

I keep coming back to one thing. The bug we found today was not a hard bug. It was a small, bounded, fixable mistake — the kind of thing any engineer would have spotted in five minutes if they happened to be looking at the right log line.

Nobody was looking. Nobody was going to look. It would have hidden until the migration finished and the damage became visible.

The thing that broke this pattern was not a smarter model or a better dashboard. It was that the model could ask the question, and the answer was right there, in the same conversation. That is the loop we are betting on. It feels small from the inside. From the outside, I think it is going to look like a quiet shift in how production systems are kept healthy.

A flaky test on a Wednesday afternoon is not where I expected to start writing about that. But here we are.

· 7 min read
Elisha Sterngold

Dogfooding Shipbook

Why We Started Dogfooding Shipbook — and What We Found

There is an old principle in software: use what you build. The industry calls it dogfooding — short for "eating your own dog food," meaning if you build a product, you should use it yourself. The logic is simple: if it is not good enough for you, it is not good enough for your customers. If you are not experiencing your own product the way your users do, you are flying blind. You can read every support ticket, study every metric, and still miss what it actually feels like when something goes wrong.

For years, Shipbook was a logging platform built for mobile apps. Our SDKs covered iOS, Android, Flutter, and React Native. Our users were mobile developers — and so was I. Before Shipbook, I was VP R&D at a mobile app services company, which is where the idea for Shipbook was born. But time passes. As the product grew, I spent less time inside mobile apps and more time building the platform itself — the web console, the backend, the infrastructure. Even though Shipbook was born from the mobile world, our own day-to-day work had moved beyond it. Our stack — a web console, a Node.js backend — lived outside the reach of our own tools. We could see our users' logs, but we could not see our own.

That had to change.

Building the SDKs We Needed

We added a browser SDK and a Node.js SDK to our JavaScript SDK family. The main motivation was to close the gap between us and our users. We wanted to instrument our own web console and backend services with Shipbook, to see our own errors, our own warnings, our own performance issues flow through the same pipeline our customers rely on.

The moment we deployed them, something shifted. Issues that had previously been abstract — a user reporting a vague problem, a spike in an error metric — became concrete. When the console threw an error, we saw it in our own logs. When the backend hit an edge case, we felt it. There is a fundamental difference between reading a report about a problem and encountering it yourself while doing your own work.

The Difference Between Hearing and Feeling

When a user files a bug report, you investigate. You look at the evidence, reproduce the issue if you can, and fix it. It is a rational process. But when you yourself hit that same issue — when you are in the middle of debugging something else and the console behaves unexpectedly — you feel it differently. The urgency is not simulated. The frustration is not secondhand. You do not need a priority score to know this needs fixing.

This is the real argument for dogfooding. It is not just about finding bugs. It is about changing your entire relationship to your product. When you use it daily, you do not only discover what is broken — you discover what is missing. You feel the features that should exist but do not. You notice the workflows that are clunky, the information that is hard to find, the capabilities you keep wishing you had. No feature request from a user can replicate that intuition. Dogfooding drives not just quality, but product direction.

We started noticing things our users had probably noticed for months. Small annoyances, missing capabilities, rough edges that individually seemed minor but collectively degraded the experience. The kind of things that rarely make it into a support ticket because no single one is worth reporting — but that erode trust over time.

When Claude Met Our Logs

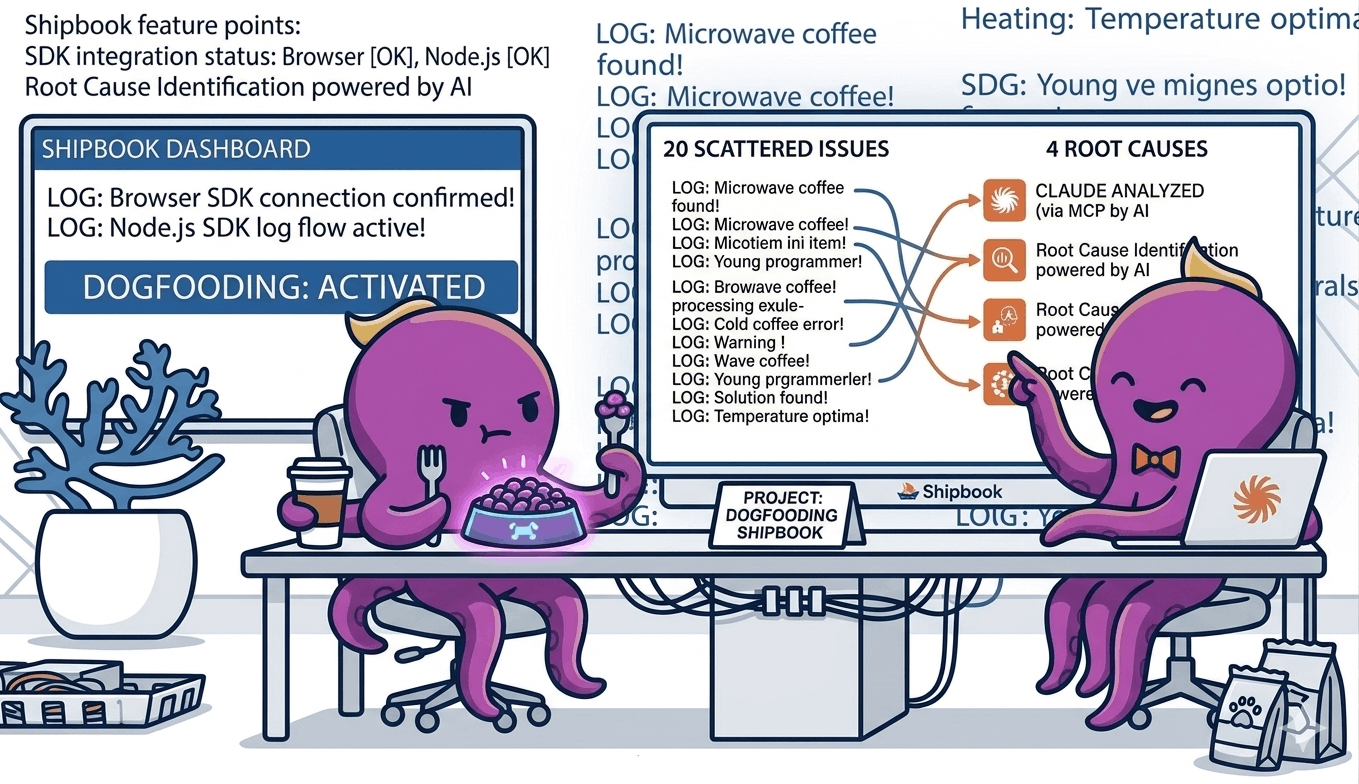
The most surprising chapter came when we connected Claude to our Shipbook data through an MCP server. We gave it access to our Loglytics — the aggregated error analytics that Shipbook computes across sessions — and asked it to analyze the issues.

Loglytics was already doing a good job — it had identified around twenty distinct error patterns, grouped and ranked by frequency and impact. That alone is valuable. But what happened next is where the real power showed up.

Claude processed the full Loglytics output and consolidated the twenty issues into four root causes. Not four categories — four actual underlying issues. And then it did not stop at the analysis. It went ahead and fixed them directly in the code.

This is where the combination of Shipbook Loglytics, MCP, and Claude Code becomes something greater than its parts. Loglytics surfaces the problems. MCP gives Claude access to that data. And Claude Code has the ability to reason about the issues and write the fixes. The entire loop — from detection to diagnosis to resolution — happened without manual triage, without prioritization meetings, without context-switching between tools.

Ground Truth Changes Everything

This experience crystallized something we had been thinking about for a while: AI is most powerful when it has ground truth to work with. Give a model a vague question and you get a vague answer. Give it structured, real-world data — actual logs, actual error patterns, actual stack traces — and it becomes remarkably precise.

Our logs were not just records of what happened. They were the ground truth that made Claude's analysis trustworthy. Every conclusion it drew was anchored in real data from real sessions. There was no hallucination risk because the model was not speculating — it was reasoning over facts.

This is where logging and AI intersect in a way that feels genuinely new. Logs have always been valuable for debugging. But when you feed them to a model that can reason about patterns at scale, they become something more: a foundation for proactive quality improvement.

Fixing Issues Before Users Complain

The most valuable outcome was not just finding the four root causes. It was fixing them before our users had to ask. We knew from the data that these issues were affecting real sessions. We could see the frequency and the impact. But no one had filed a ticket yet — or if they had, it was buried in vague descriptions that did not point to the root cause.

By dogfooding our own system and letting AI analyze the results, we moved from reactive support to proactive improvement. We did not wait for complaints. We saw the problems ourselves, understood them deeply, and resolved them.

This is the cycle we now believe every product team should aim for: use your own product, instrument it thoroughly, feed the data to AI, and fix what it finds — before your users have to tell you something is wrong. It is a higher standard of quality, and it is only possible when you are willing to be your own harshest critic.

The Lesson

Building a product you do not use yourself is like writing a book you never read. You might get the structure right. You might catch the obvious errors. But you will miss the experience — the pacing, the friction, the moments where things just do not feel right.

We should have dogfooded Shipbook sooner. Now that we have, we cannot imagine going back. Every issue we find in our own usage is an issue we fix for everyone. And with AI turning our logs into actionable insights, the gap between "something is wrong" and "here is exactly what to fix" has never been shorter.